Excel Worksheets + Lumetics LINKTM
Lumetics experts provide support and training to our global clients. We provide supplementary downloadable material to help streamline your process. Let LINK do your heavy lifting!
How Can LINK Help With Excel Worksheets?
LINK is the software solution for automated analytical data import, analysis, and reporting. LINK scans network locations for new measurement files, extracts all useful data, and copies this data directly to a centralized database. The powerful analysis user-interface allows datasets to be aggregated, grouped, and visualized in the form of charts/tables/images. User-customizable analysis templates deliver rapid and error-free data visualization, with the ability to be replicated across many studies and shared within your organization.
LINK supports the ability to import Excel Worksheets as measurement files. These contain header rows and columns that are then transformed into LINKdb fields and values. Once imported, visualization preferences can be structures around the excel data. LINK has been demonstrated to deliver time savings more than 90% and provide a highly affordable fully automated data management and analysis solution.
Common Excel Worksheet Application Areas
LINK may be utilized to assist directly in the following application areas:
Any data for instruments currently not supported by LINK
Additional/specific measurements
Measurements with no raw data
Metadata import
Visualize your Excel Worksheet Data with LINK
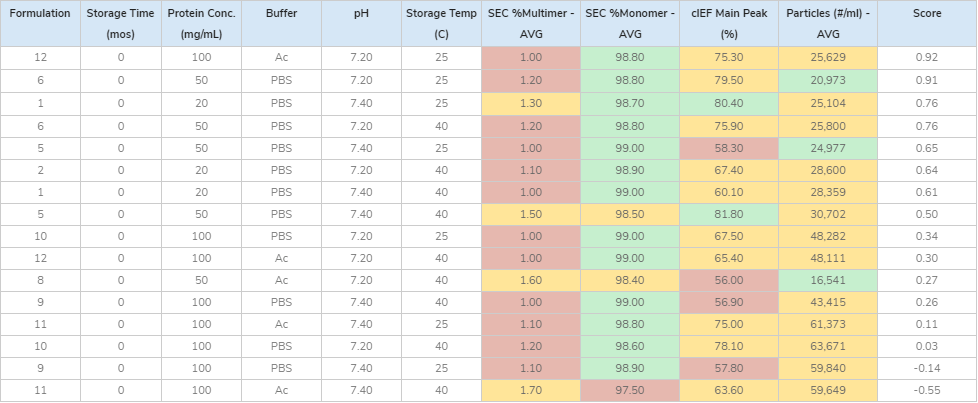
Tabular Summaries
Critical Quality Attribute vs. Process Variable
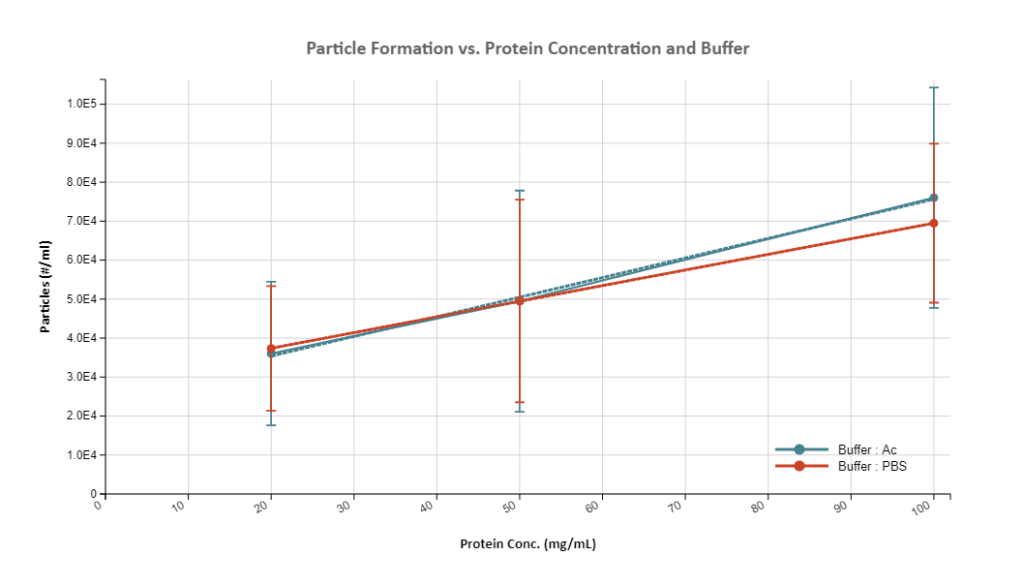
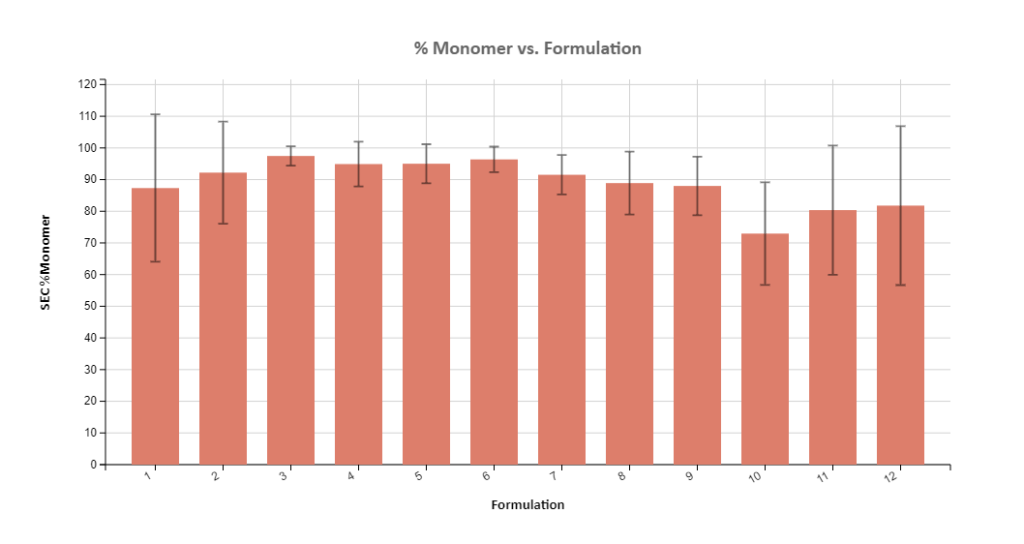
Critical Quality Attribute vs. Process Variable
Multiple Critical Quality Attribute Visualization
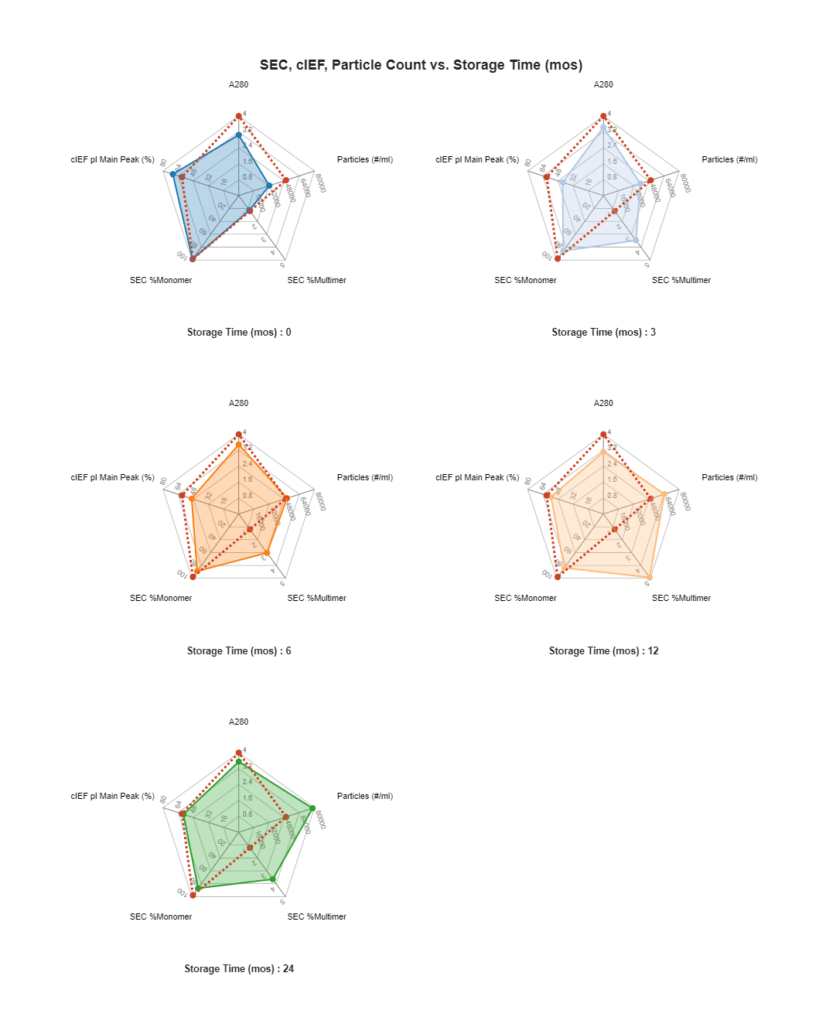
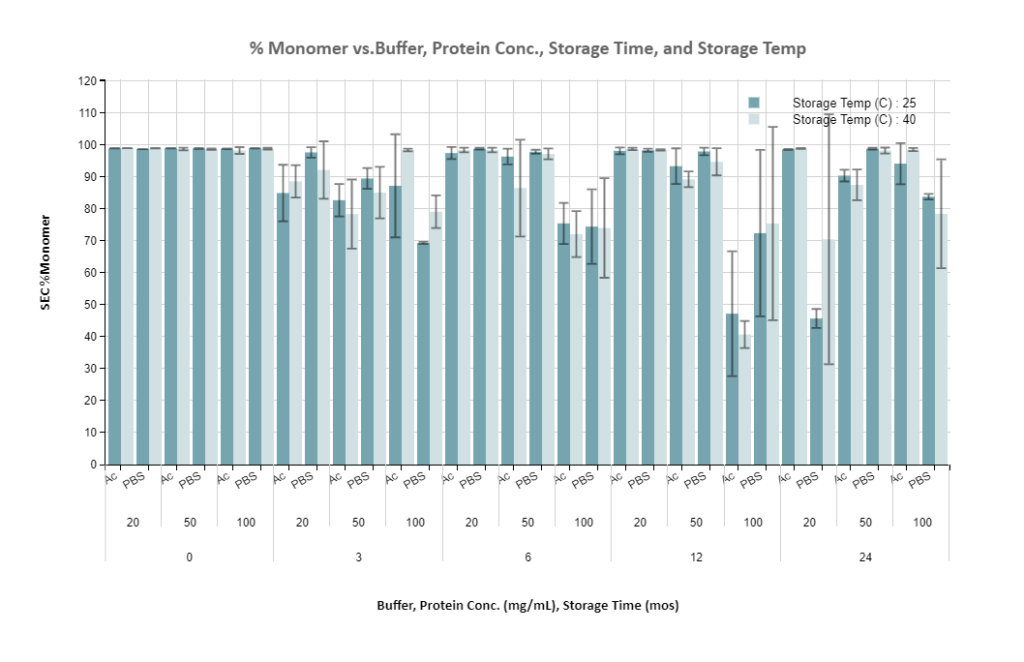
Multi-Factor Visualization
Additional Information for Excel Workbook Instrument Import
LINK has specific requirements for the import of excel workbooks as instrument measurement data, including:
LINK requires use of the Lumetics Excel Measurement Import Template to import data from Excel
Data may be imported from the “Import” worksheet, beginning with cell B2
Data from another spreadsheet can be copied directly into the Import tab of the Excel Measurement Import Template worksheet (paste special as values only, is recommended)
Each column represents data pertaining to that specific Measurement
The Instrument type in LINK, will appear as “Excel Instrument”
Cells must be formatted as General (other formats, such as number, will not import properly)
New data fields not already in the Lumetics database as either a User or Instrument LINKdb Field, will automatically be created
Sample Name must be entered for each measurement, else that measurement will not be imported
Measurements are determined to be unique based on the Excel FileName, Sample Name, Analysis Date (if present), Column A representing row number (if present) and optionally Replicate Number if included as a column parameter
The ‘Excel Row’ column may be removed from the Lumetics excel template. Upon doing so, LINK will no longer include this as part of the ‘unique measurement identifier’, and therefore when the same Sample Name data has been shifted to a different row, it will not be considered a ‘new measurement’ and added to the project. Note: if Excel Row is removed and Sample Name legitimately appears in say three different rows (e.g., it was tested in triplicate), only one of these will be imported as the rest will be considered duplicates. Therefore, a column called ‘Replicate Number’ is recognized as part of the unique measurement identifier.
There can be no blank header columns. LINK will read the empty header column as a trigger to “stop” the import, therefore anything after this column will not be imported. This is rule also applied to the excel rows. If there is a completely empty row (column A must be empty as well), LINK will trigger a ‘stop’ and not read further rows.
LINK will read header fields as duplicated if when stripping out the special characters, the root name is the same. (i.e >=2 μm [FlowCam] removing > = + [ ] is then the same as <2 μm [FlowCam]). Therefore, unique header names are recommended.
Special Characters (ie. ‘ + = % $ # μm) are currently not supported
Currently, no raw curve data may be imported from Excel. Therefore, the dashboards that can be utilized to visualize excel data are: Column chart, Trend chart, XY scatter, 2D Histogram, and Radar Chart.
For LINK to have a field available as a Y-axis option, all values must be numeric (ie. no text). If a single text value is present, the field will not be available as a Y-axis option but rather as an X-axis option.
Support for additional data file formats is available free of charge – please contact Lumetics for additional information!
Downloadable Content
Learn more with each downloadable application note that provides a more detailed overview for advanced LINK functions and specific instrument instructions. This includes information on instrument mandatory import file types, raw curves included, and specific import method options. In addition, Lumetics provides an extensive built-in dashboard library within your LINK instance from LINK version 2.4.0.210401 and later. For development of custom dashboard/analysis templates, contact Lumetics.
Excel application note: click to download
Excel Import Template: click to download
