
LINK Quick Start Guide
If you’re new to the LINK platform, this self-guided training will help you get started quickly and confidently. By the end, you’ll know how to import data, analyze results, create reports, and manage your projects and analysis templates.
Follow along step-by-step below to begin your LINK journey.
STEP 1: Launching the LINK Client
The desktop LINK client is a portable, stand-alone web application used to access the LINK server. Alternatively, users may connect to the LINK server using supported web browsers such as Google Chrome or Microsoft Edge.
User authentication is managed through Windows Active Directory (AD) and LDAP/LDAPS integration. Each user account is assigned one of five configurable access levels:
- Administrator
- Super User
- Analyst
- Reviewer
- Read-Only Viewer
To access the LINK client, log in using the authentication method and credentials configured for your organization.
STEP 2: Import Data
The Data Import function is used to locate instrument data files on the network and copy all relevant information into the LINKdb. The resulting sample measurements or sample result sets become available within the LINK software for visualization, manipulation, and export. Data imports can be initiated manually or configured to run on a scheduled basis.
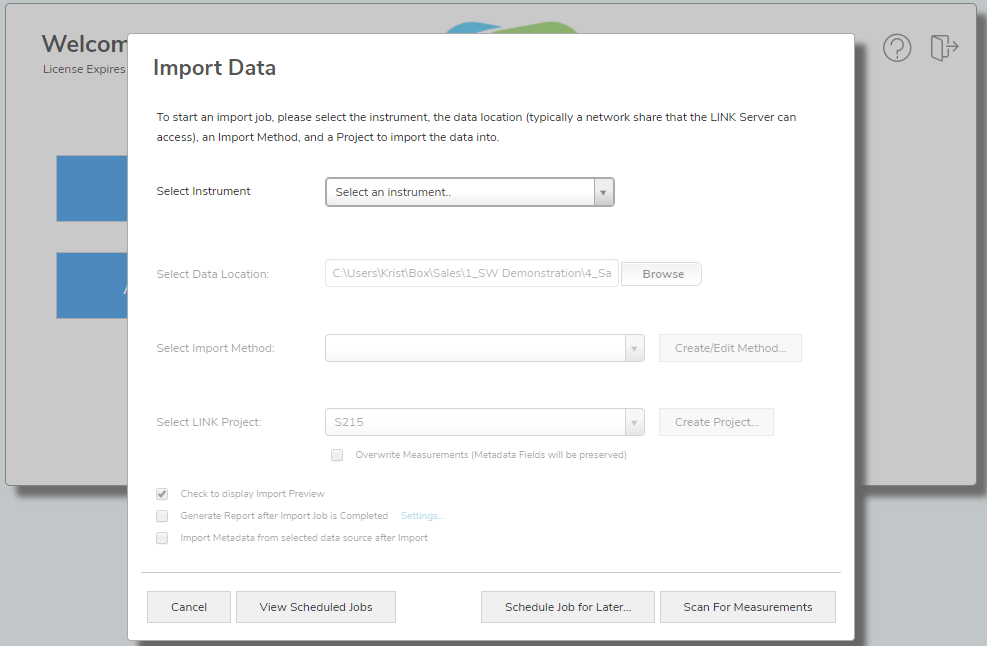
Import Process:
- Select Data Import from the main interface.
- Choose the instrument for which data will be imported.
- Specify the data location, typically a network share accessible to the LINK Server.
- Select an appropriate Import Method, which defines instrument-specific data processing parameters.
5. Create a new Project or select an existing one to store the imported data.
6. (Optional) Configure additional import options:
-
- Overwrite measurements if re-importing existing data.
- Generate a report automatically following data import.
- Import metadata associated with the data files.
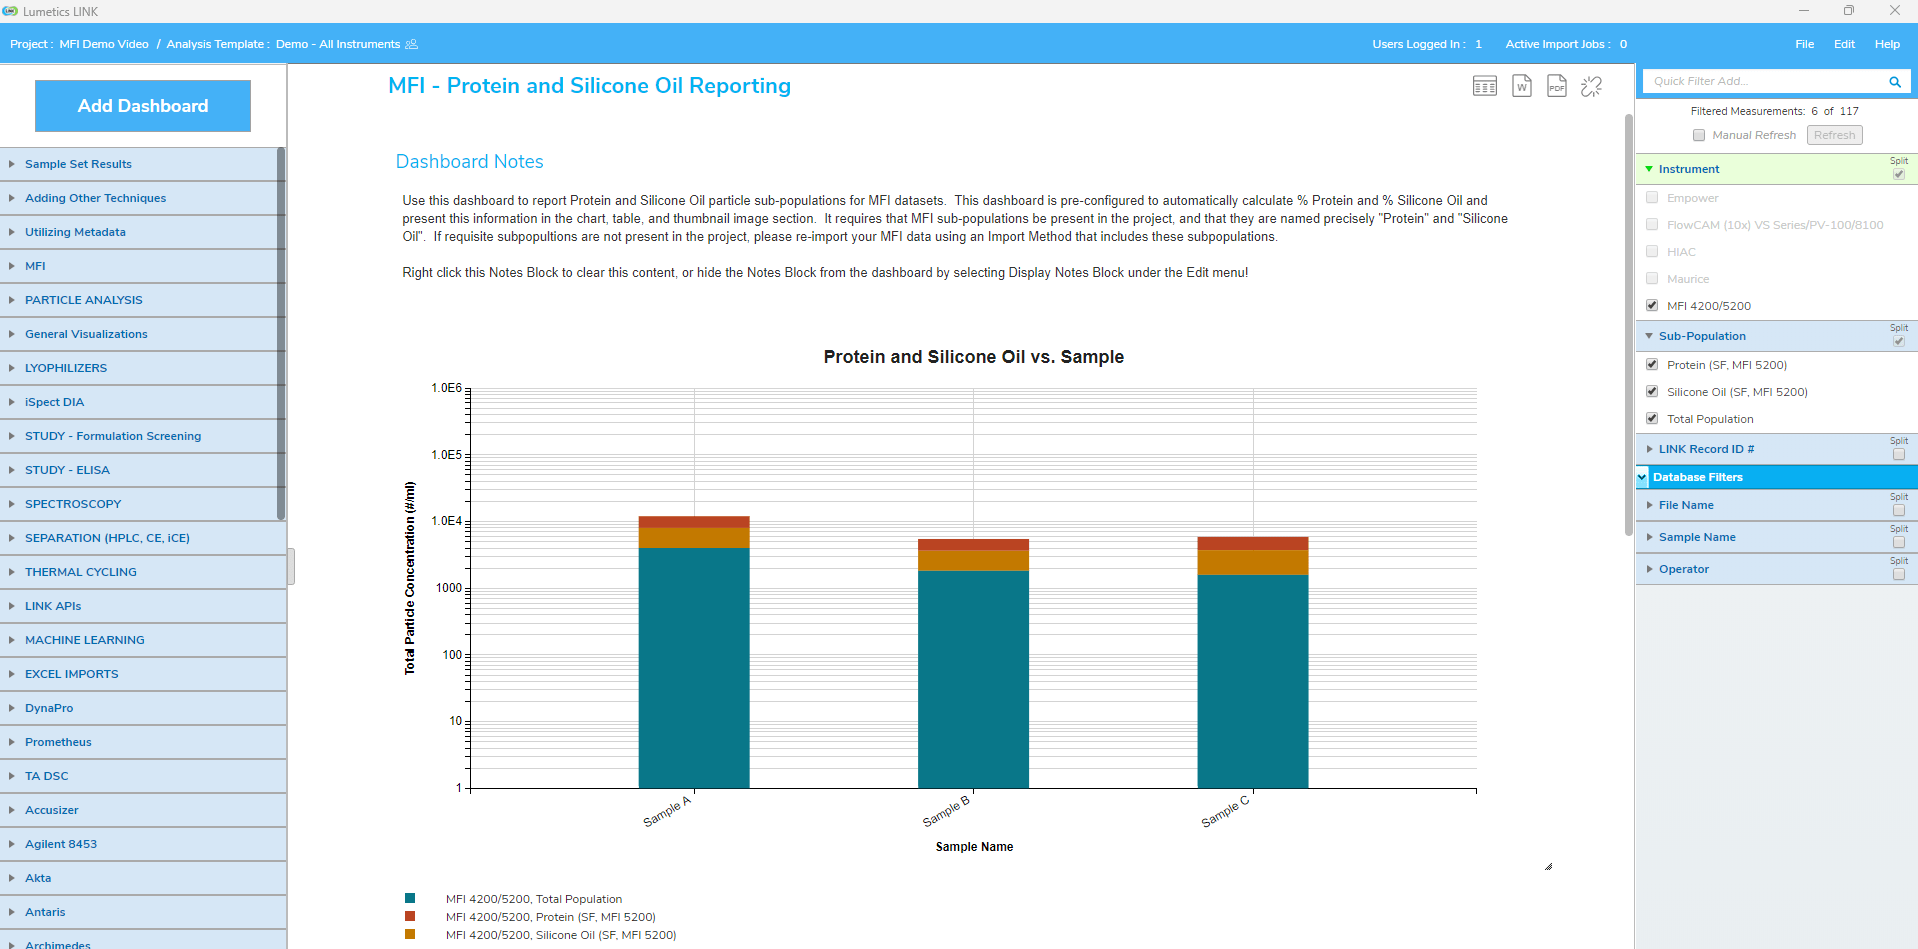
STEP 3: Analyzing and Visualizing Data
An Analysis Template defines how data is visualized within LINK. Each template consists of one or more dashboards, where each dashboard can include: a chart, a notes block, up to 10 tabular summaries and thumbnail images (if applicable). The Analysis and Reporting feature allows users to create and configure analysis templates—defining preferred data visualization layouts—and apply them to selected LINK projects.
Creating an Analysis Template
- Select Analysis and Reporting from the main menu.
- Select the Project containing the data to visualize.
- LINK will automatically select an analysis template matching the project name (if one exists), or the most recently used template associated with that project.
- If no template is found, New Template will appear as the default.
- An analysis template may be applied to any project of interest.
Exploring Dashboards: There are two primary types of dashboards: Raw Data Dashboards – visualize raw XY datasets such as curves or distributions. Parameter Dashboards – plot calculated parameters derived from raw data, or any other user-defined fields within the LINKdb.
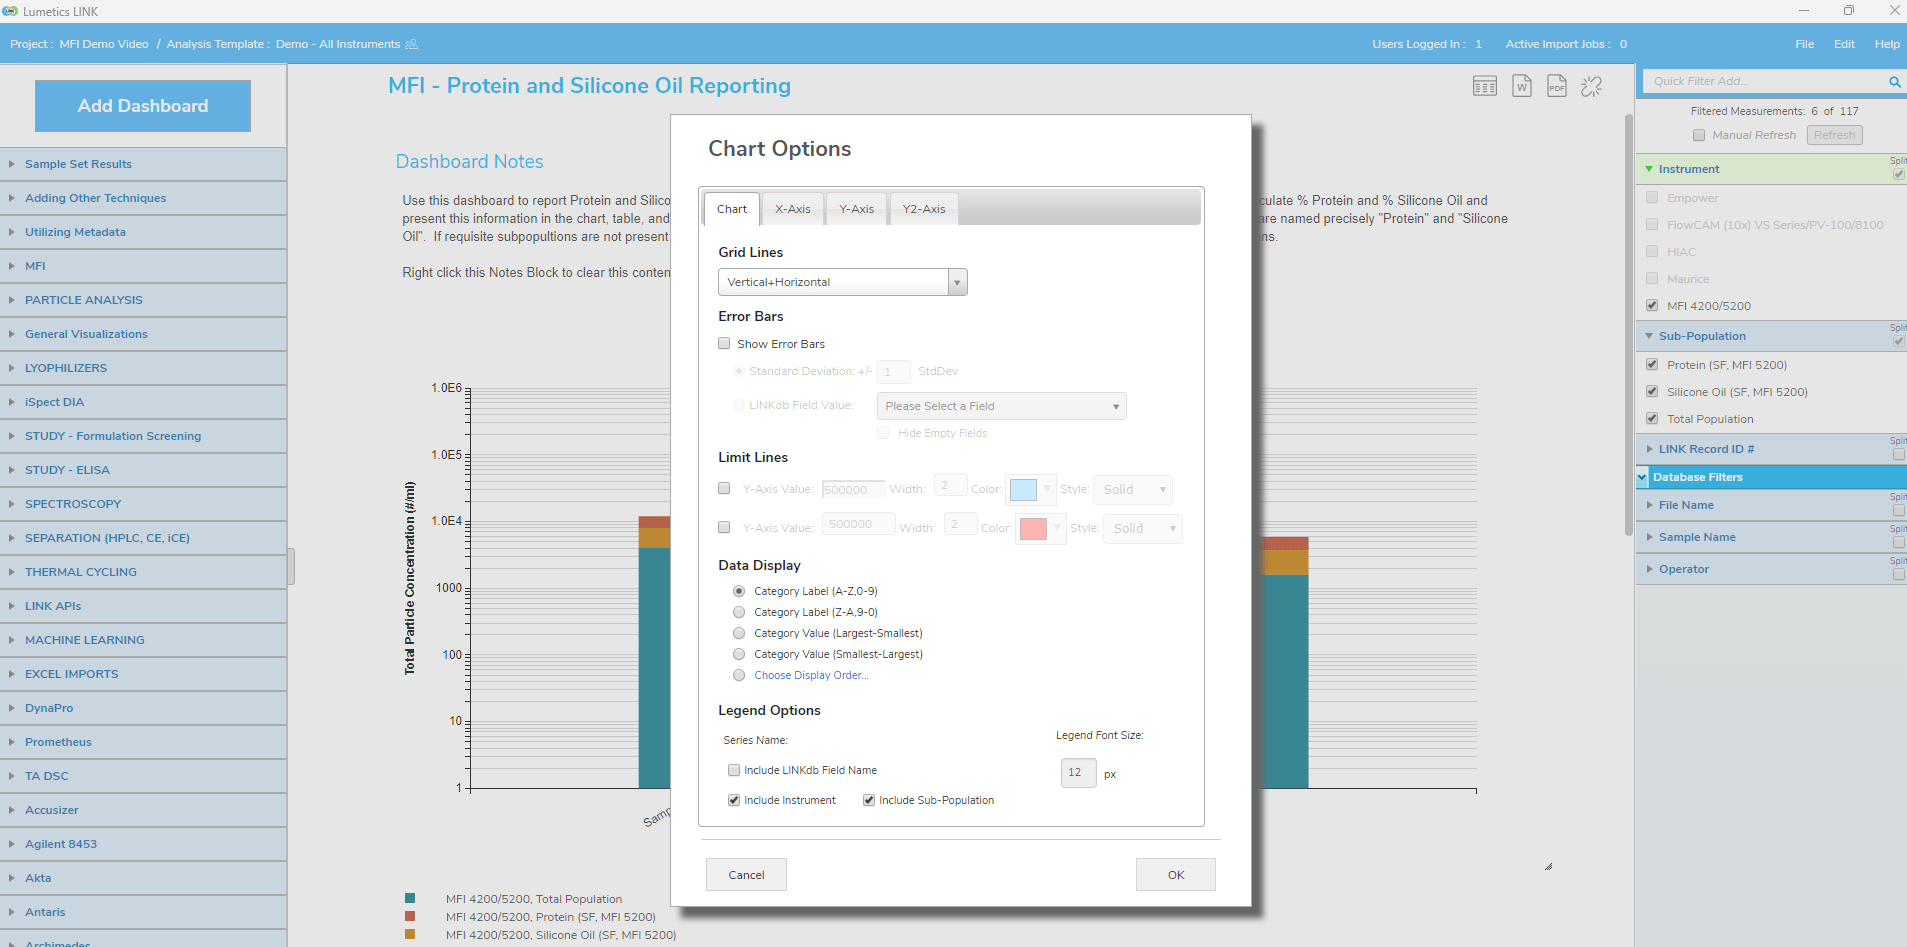
Each dashboard is fully customizable to reflect user-defined visualization preferences.
- Right-click on a dashboard element to change visualization preferences.
- Right-click on a dashboard element to copy the displayed image or data to the clipboard.
- Right-click in the surrounding white space to reorder, hide, or show dashboard elements.
Editing an Analysis Template: Once an analysis template has been created, it can be modified to include additional visualization preferences or layout changes.
Editing options include:
- Applying an existing Analysis Template to a project.
- Adding new Dashboards.
- Using the Dashboard Panel to organize and manage dashboards.
- Manipulating the Filter Panel to refine displayed data.
STEP 4: Add Measurement Metadata
LINK supports the creation of User LINKdb Fields to associate additional metadata with sample measurements. Metadata refers to any supplementary information applied to sample result sets and may be incorporated into analysis, processing, and reporting workflows. Metadata may include:
- Standard database fields containing test results or numeric values.
- Values calculated from measurement curve data.
- Data derived from other database entries related to the same sample measurement.
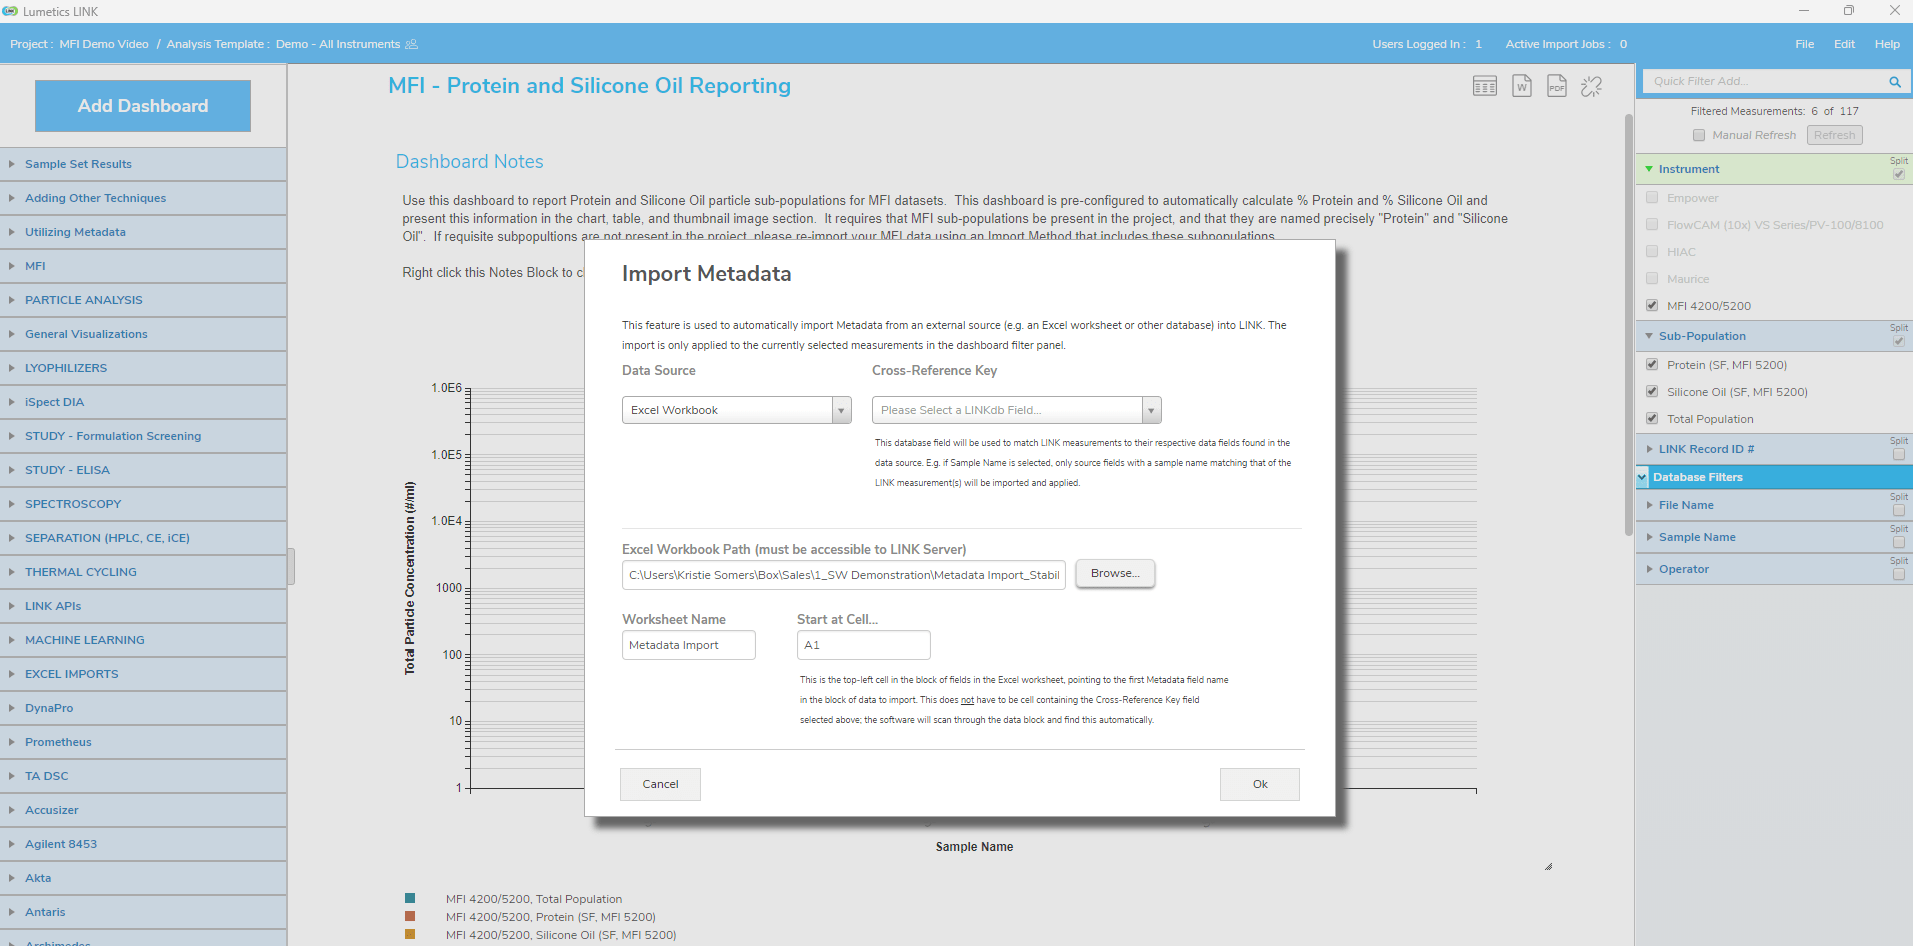
Metadata may be populated using one of the following methods:
- Manual entry – applied on a per-measurement basis within the Import Method configuration.
- Automated import – applied to all measurements within a project from an external data source (e.g., Excel file) using user-defined matching criteria.
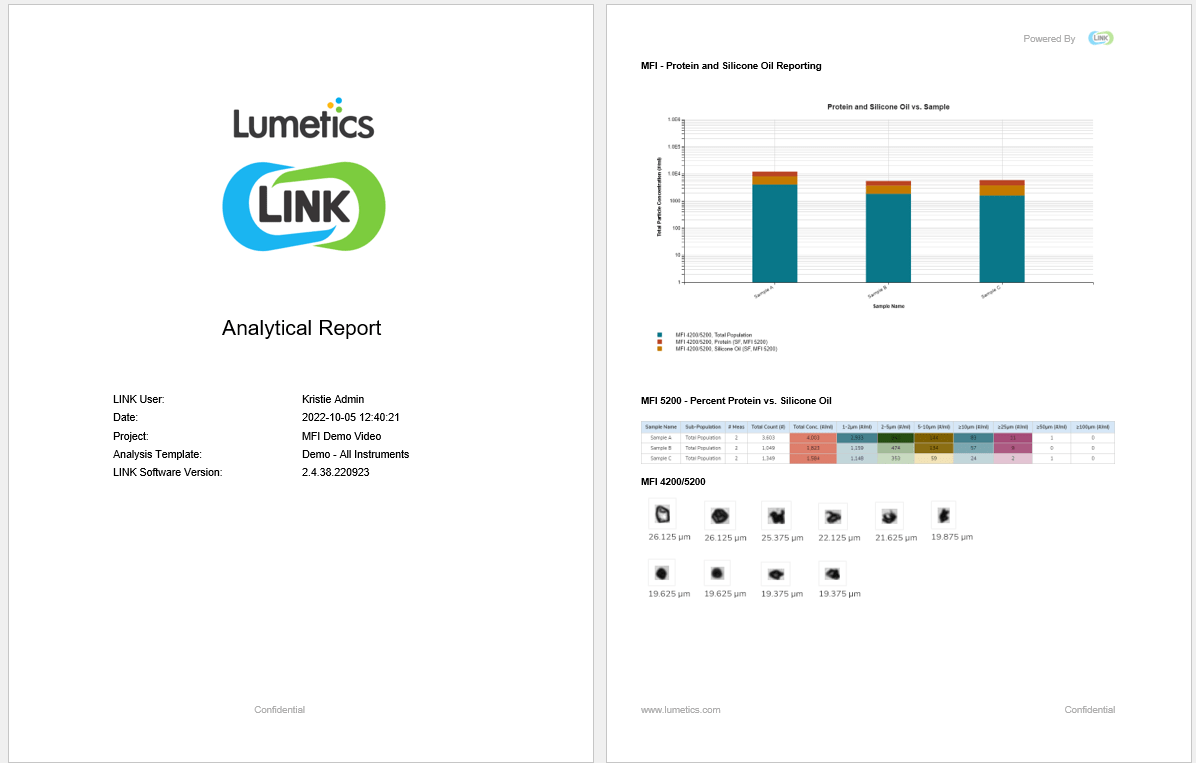
STEP 5: Reporting Data
LINK provides several tools to export processed data for external use and reporting. Available export options include:
- Dashboard Images – Any dashboard object can be exported as an image (e.g., copied to the clipboard for pasting into Word or other applications).
- Tabular Data – Data from dashboard elements can be exported in TSV (Tab-Separated Values) spreadsheet format.
- Reports – Entire dashboards can be exported as PDF or Word reports, including support for user-defined custom Word report templates.
- Server Data Access – Project-level data, or data aggregated and processed by LINK within charts and tables, can be retrieved directly from the LINK Server using a URL, when the LINK API is enabled.
How to export within the analysis template:
- Dashboard Images & Table Data – right-click on any image or table to export the underlying data and/or the image itself.
- Reports – select “file” – generate word report, or use the Word and PDF toggles at the top right of the dashboard.
STEP 6: Managing the LINK Database
The LINKdb Management tool provides functionality for searching, viewing, and managing entities within the LINK database (LINKdb).
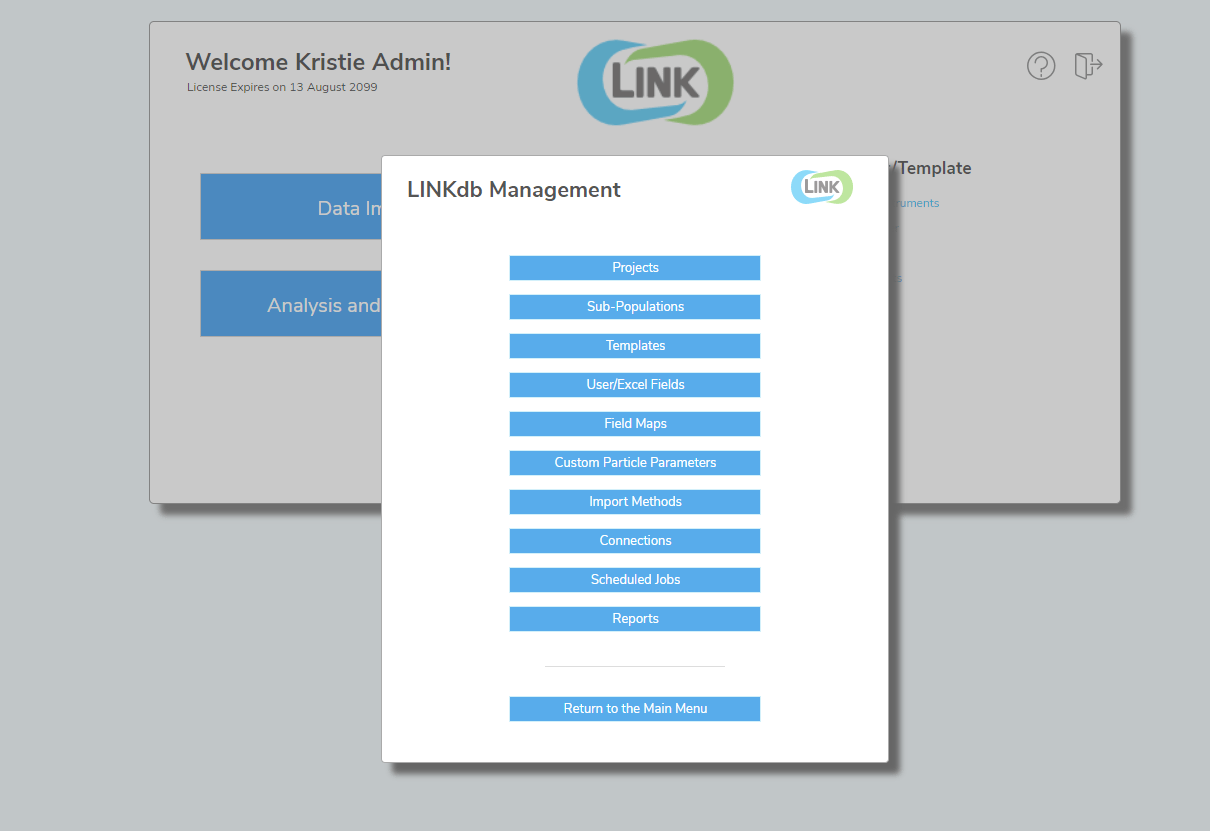
Use LINKdb Management to perform the following actions:
- Projects, Analysis Templates, and Measurement Summary Table Templates (Tabular Summaries): View, rename, edit, share/unshare, lock/unlock, and delete.
- User Fields: View, rename, edit, and create LINKdb User Fields.
- Sub-Populations: View, rename, edit, and create Sub-Populations.
- Custom Particle Parameters: View, rename, edit, and create Custom Particle Parameters.
- Additional Administrative Functions: Perform other database management operations as required (e.g., user access, cleanup, and maintenance tasks).
Next Steps …
Schedule a live training session with Lumetics experts or view the Training Video Library to learn more!